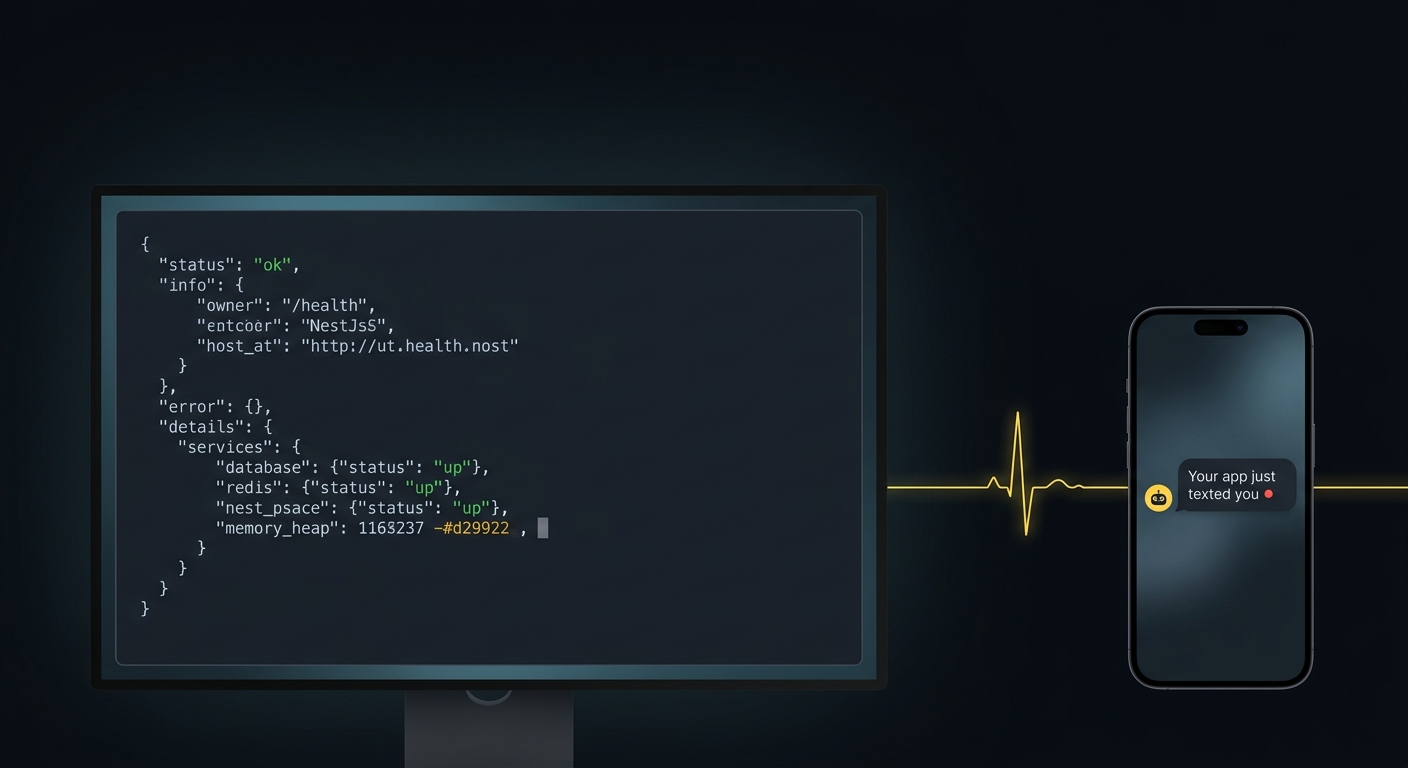
A NestJS health check is an HTTP endpoint that reports whether your app can actually serve traffic, and the standard way to build one is @nestjs/terminus. Install it, import TerminusModule, and expose a HealthController that runs a list of indicator functions behind the @HealthCheck() decorator. When every indicator passes you get 200 with status: "ok"; when one fails you get 503. That 503 is the whole point: it's the signal a load balancer, an orchestrator, or an external monitor keys off to route around a sick instance or wake you up.
Most tutorials stop at "here's a /health route that returns 200." This one covers that in the first two minutes, then the parts that actually keep you from getting paged at 3am: the liveness-versus-readiness split, a timeout on the database ping so the check can't hang, and the two things Terminus does not do for you.
How do you add a health check to a NestJS app?
Install the module and wire up a controller. Terminus gives you HealthCheckService to run the checks and a set of indicators for common dependencies.
npm install --save @nestjs/terminus
// health.module.ts
import { Module } from '@nestjs/common';
import { TerminusModule } from '@nestjs/terminus';
import { HealthController } from './health.controller';

@Module({
  imports: [TerminusModule],
  controllers: [HealthController],
})
export class HealthModule {}
// health.controller.ts
import { Controller, Get } from '@nestjs/common';
import {
  HealthCheck,
  HealthCheckService,
  HttpHealthIndicator,
  TypeOrmHealthIndicator,
} from '@nestjs/terminus';

@Controller('health')
export class HealthController {
  constructor(
    private health: HealthCheckService,
    private http: HttpHealthIndicator,
    private db: TypeOrmHealthIndicator,
  ) {}

  @Get()
  @HealthCheck()
  check() {
    return this.health.check([
      () => this.http.pingCheck('self', 'https://docs.nestjs.com'),
      () => this.db.pingCheck('database'),
    ]);
  }
}
Hit GET /health and Terminus returns a structured payload:
{
  "status": "ok",
  "info": { "self": { "status": "up" }, "database": { "status": "up" } },
  "error": {},
  "details": { "self": { "status": "up" }, "database": { "status": "up" } }
}
info holds the indicators that are up, error holds the ones that are down, and details holds all of them. If any indicator fails, HealthCheckService throws ServiceUnavailableException, the response comes back as 503, and the failing check moves into error.
Terminus ships indicators for more than TypeORM: HttpHealthIndicator, MongooseHealthIndicator, SequelizeHealthIndicator, MikroOrmHealthIndicator, PrismaHealthIndicator, MicroserviceHealthIndicator, GRPCHealthIndicator, MemoryHealthIndicator, and DiskHealthIndicator. You compose the ones your app depends on into the array you pass to check().
What should a liveness check and a readiness check actually do?
They answer two different questions, so they should be two different endpoints.
- Liveness asks "is this process alive and its event loop responsive?" It should touch nothing external. No database, no Redis, no downstream HTTP. If a liveness check fails, the correct response is to restart the process, so it must only fail when the process itself is wedged.
- Readiness asks "can this instance serve a real request right now?" It checks the database and any dependency a request needs. If readiness fails, the correct response is to stop sending traffic to this instance, not to kill it.
Collapsing both into one deep endpoint is the classic mistake. If your restart trigger points at a check that pings the database, a two-second database failover can fail the check on every instance simultaneously, and now your orchestrator restarts the entire fleet during the exact moment the database is recovering. A shallow liveness check plus a separate deep readiness check keeps a dependency blip from becoming a self-inflicted outage.
A dependency-free liveness endpoint doesn't even need Terminus:
@Get('live')
live() {
  return { status: 'ok' };
}
The readiness endpoint is where Terminus earns its place, and where you want a timeout.
How do I check the database without the health check hanging?
A naive pingCheck('database') can block for the driver's full connection timeout if the database is unreachable, which means your health endpoint hangs right when you most need a fast answer. Give the ping an explicit, short timeout so the check fails fast instead of hanging:
@Get('ready')
@HealthCheck()
ready() {
  return this.health.check([
    () => this.db.pingCheck('database', { timeout: 300 }),
    () => this.memory.checkHeap('memory_heap', 300 * 1024 * 1024),
    () => this.disk.checkStorage('disk', { path: '/', thresholdPercent: 0.9 }),
  ]);
}
A few practical notes on that readiness list:
pingCheck('database', { timeout: 300 })fails the check if the database doesn't answer a lightweight query within 300ms. Pick a number a little above your normal query latency, not your worst case, so a genuinely slow database still trips it.checkHeap('memory_heap', 300 * 1024 * 1024)marks the instance unhealthy if V8 heap usage crosses 300MB.checkRSSdoes the same for resident set size. Set the threshold from your app's real baseline, not a guess.checkStorage('disk', { path: '/', thresholdPercent: 0.9 })fails when the disk is 90% full, which catches log or upload volumes before they wedge the app.
Keep the readiness set small and cheap. Every indicator you add runs on every poll, and a monitor may hit /ready every 30 to 60 seconds. Check the things a request genuinely can't proceed without, and leave the nice-to-haves out.
What status does Terminus return during shutdown?
When your app is shutting down but still accepting connections, Terminus reports status: "shutting_down". Combined with NestJS shutdown hooks (app.enableShutdownHooks()) and a graceful timeout, this lets a load balancer see the endpoint go unhealthy and drain traffic before the process actually exits, so in-flight requests aren't cut off:
TerminusModule.forRoot({
  gracefulShutdownTimeoutMs: 1000,
});
So the endpoint has three honest states: ok (200), error (503), and shutting_down. All three are useful to whatever is watching, which brings us to the part every Terminus guide skips.
Your /health endpoint doesn't monitor anything
This is the gap. Terminus reports health when something asks. It does not watch your app, and it will never text you. A /ready endpoint that returns a beautiful 503 at 3am does exactly nothing if nothing is polling it and nobody is being paged.
Two mistakes follow from missing this:
- Assuming the platform covers it. Platform health checks, like Fly.io's
[[http_service.checks]], drive routing and restarts. They decide whether to send traffic to an instance or cycle it. They do not decide whether to wake you. A crash-looping app can restart quietly all night while your inbox stays empty. - Assuming a green endpoint means a green app. The endpoint only reports what its indicators check. Anything outside that list is invisible, including the background work covered in the next section.
What closes the gap is boring and external: something off-box that hits your readiness URL on an interval and alerts a channel a human reads. That's the entire job of an uptime monitor. CanaryHub polls the endpoint, understands the Terminus contract (503 means down, a 2xx with a degraded body means partial), and pings Telegram, Slack, Discord, or email the moment it flips. It's HTTP polling from the outside, which is the one perspective your own process can never have about itself. The free tier watches 3 monitors on a 5-minute interval; paid plans drop to 60-second checks with instant alerts.
What about background jobs your health check can't see?
Here's the failure mode Terminus is blind to by design. Your NestJS app almost certainly runs work that isn't tied to an HTTP request:
- A
@Cron()task from@nestjs/schedulethat emails a daily digest or reconciles payments. - A BullMQ or Bull worker draining a queue.
- An interval job refreshing a cache or rotating a token.
/health returns 200 the whole time one of these silently dies. The web process is fine, the database is fine, every indicator is green, and the nightly job simply stopped firing three weeks ago. There is no 503 to catch because nothing crashed in the request path. This is exactly the "the backup has been failing for six weeks" incident, and a health endpoint cannot see it, because the endpoint only knows about the checks you handed it.
The fix is a dead man's switch: have the job itself report success on a schedule, and alert on the absence of that report. At the end of the job, after the real work has succeeded, ping a unique monitor URL:
import { Cron } from '@nestjs/schedule';

@Cron('0 3 * * *')
async runNightlyDigest() {
  await this.buildAndSendDigest();

  // Only reached if the work above succeeded.
  await fetch('https://ingest.canaryhub.ai/ping/YOUR_TOKEN');
}
Configure the monitor with the job's expected interval plus a grace period. If the ping doesn't land in time, something died: the task stopped scheduling, the worker wedged, the deploy dropped the cron, the container never came back. Silence becomes the failure signal, which is the only thing that works when the failure mode is "didn't run at all." The same pattern works for a BullMQ processor: ping after the job completes, not when it's enqueued.
Putting it together
A production-ready NestJS health setup is three pieces, not one:
- A shallow liveness endpoint that only fails when the process is wedged, wired to restarts.
- A deep readiness endpoint built with Terminus, with a timeout on the database ping and a tight indicator list, wired to traffic routing.
- Two things Terminus doesn't do: an external monitor polling readiness and paging a human on 503, and a heartbeat on every background job so a silent death still reaches you.
Get the endpoints right first, because a wrong health check is worse than none. Then remember that the endpoint is a sensor, not a monitor. If you're wiring up the heartbeat side, the dead man's switch walkthrough covers the pattern end to end, and the crontab timing guide helps if you're setting the job's expected interval.