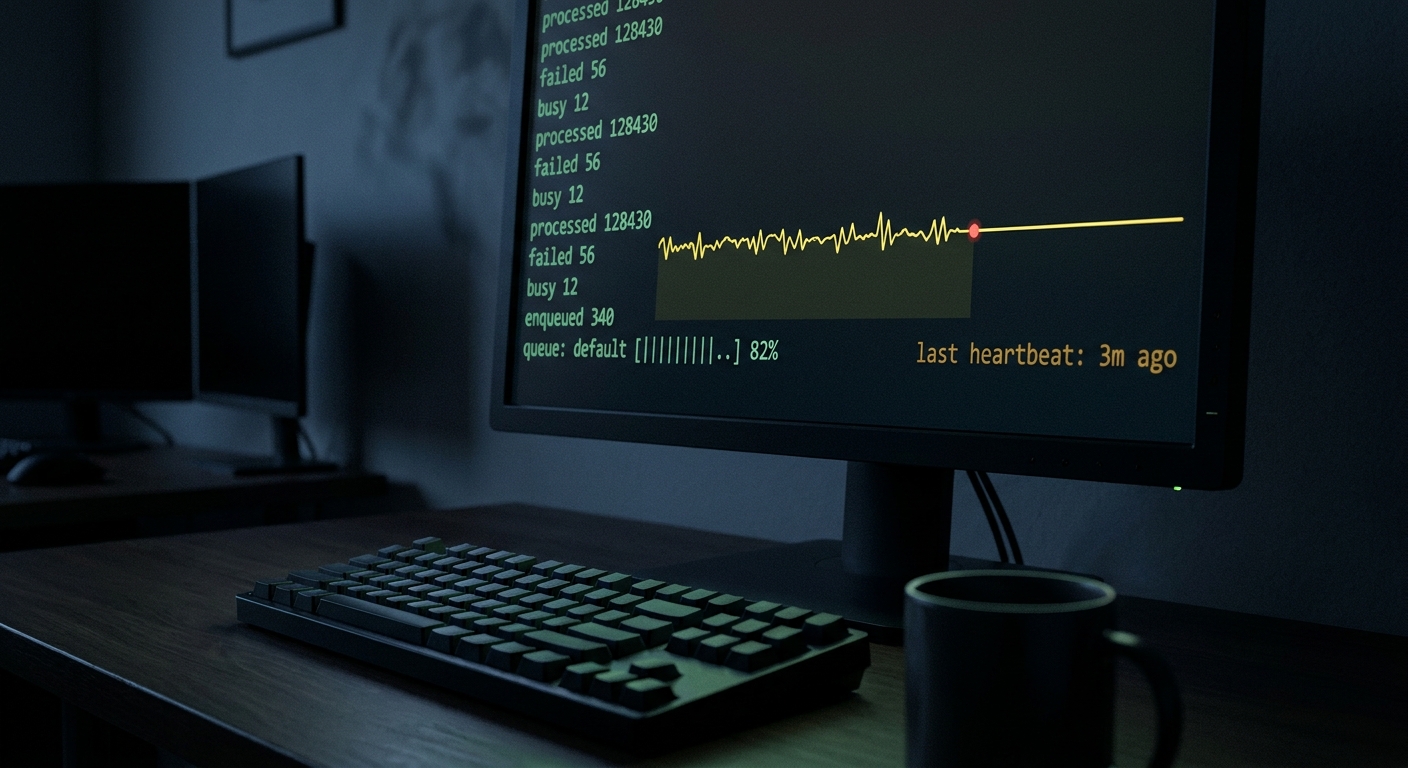
Sidekiq's own Web UI already tells you a lot: how many jobs are queued, how many failed, how fast workers are churning through the backlog. What it can't tell you is whether Sidekiq is still running at all, because the dashboard is a view into the process, and a process that's crashed or been OOM-killed has stopped reporting anything, including the fact that it stopped. Monitoring the jobs and monitoring whether Sidekiq itself is alive are two different problems, and most setups only solve the first one.
What does Sidekiq already show you about job health?
The built-in Web UI reads from a JSON stats endpoint at /stats:
{
  "processed": 128430,
  "failed": 56,
  "busy": 12,
  "enqueued": 340
}
/stats/queues breaks enqueued down per queue, which is the first place to look when a backlog is building faster than workers can clear it. The sidekiqmon CLI (bundled with Sidekiq 6.0+) prints the same numbers from a terminal if you'd rather not open a browser.
Failed jobs don't disappear. A job retries on an exponential backoff ((retry_count ** 4) + 15 + rand(10) * (retry_count + 1) seconds), 25 times by default, spread over about 20 days before Sidekiq gives up. At that point it moves to the Dead Set, a queue capped at 10,000 jobs or 6 months, whichever comes first, after which Sidekiq quietly discards whatever's left. All of this is visible in the Web UI. None of it pages you. You have to be the one checking.
External tools extend this same view rather than replacing it. Datadog and Scout both read Sidekiq's internal metrics to show latency percentiles and error rates per worker class, which is genuinely useful for finding a slow job, but it's still metrics pulled from a running process. If the process isn't running, there's nothing to pull.
How do I monitor scheduled Sidekiq jobs?
Sidekiq itself has no concept of "run this every night at 2am." That comes from a separate gem, usually sidekiq-cron or sidekiq-scheduler.
sidekiq-cron uses plain cron syntax and stores jobs in Redis:
Sidekiq::Cron::Job.create(
  name: "Nightly report - every day at 2am",
  cron: "0 2 * * *",
  class: "NightlyReportJob"
)
or the equivalent in config/schedule.yml, loaded automatically on boot. Either way, a Sidekiq process checks Redis for jobs that are due roughly every 30 seconds, and only the first process to ask claims the enqueue, so running multiple Sidekiq instances doesn't duplicate the job.
sidekiq-scheduler covers more trigger types (cron, every, interval, at, in) through a YAML file and Rufus Scheduler under the hood:
:scheduler:
  :schedule:
    NightlyReportJob:
      cron: "0 2 * * *"
      class: NightlyReportJob
Both gems are honest about their own limits. sidekiq-scheduler's documentation says it directly: "For a cron/at (and all other) job to be successfully enqueued, you need at least one sidekiq worker with scheduler to be up at that moment. Handling this is up to you." That's not a bug report, it's the actual contract. Nobody has built this into either gem.
What can't the Web UI or an APM tool see?
The scenario none of the above covers: the Sidekiq process itself is gone. A deploy ships a bad REDIS_URL, the container gets OOM-killed and doesn't restart cleanly, or someone edits the cron entry that was supposed to keep systemd respawning it and gets it wrong. In every one of those cases, /stats stops updating, the Web UI goes stale, and your APM dashboard shows... nothing, because nothing new is being reported. A quiet dashboard looks almost identical to a healthy one at a glance, which is exactly why this failure mode gets missed. Nothing inside the system can tell you it died, because telling you requires the system to still be running.
Cronitor's own guide to monitoring Sidekiq gets closer, with a gem (sidekiq-cronitor) that syncs your periodic job schedule to their monitors and reports on every execution. It works, but it ties the heartbeat to Cronitor specifically. The underlying pattern doesn't need a dedicated gem at all.
How do I add a heartbeat to a Sidekiq job?
Add a scheduled job whose only purpose is to ping an external URL on success, using either gem above:
class HeartbeatJob
  include Sidekiq::Job

  def perform
    Net::HTTP.post(URI("https://ingest.canaryhub.ai/ping/YOUR_TOKEN"), nil)
  end
end
Sidekiq::Cron::Job.create(
  name: "Sidekiq heartbeat - every 2 minutes",
  cron: "*/2 * * * *",
  class: "HeartbeatJob"
)
Point a monitor at that URL with an expected interval of 2 to 3 minutes and a short grace period. As long as the pings keep arriving, three things have to be true: the Sidekiq process is alive, it's connected to Redis, and the scheduler gem is actually enqueueing jobs. The moment a ping goes missing, one of those three broke, and you find out before a user does. The job deliberately does nothing else, so it can't fail for any reason other than Sidekiq not being in a state to run it.
Do I still need Cronitor, Datadog, or similar?
Depends what you're trying to catch. If you want per-job latency, error rates by worker class, or a historical view of queue depth under load, that's APM territory (Datadog, Scout, New Relic), and a heartbeat doesn't replace any of it. If you specifically want to know the moment Sidekiq stops running at all, whether from a crash, a bad deploy, or Redis going unreachable, that's the one-URL heartbeat above, and it works the same whether you're on sidekiq-cron, sidekiq-scheduler, or Sidekiq Enterprise's own periodic jobs. The two approaches answer different questions, and running both costs about ten lines of code more than running just one.