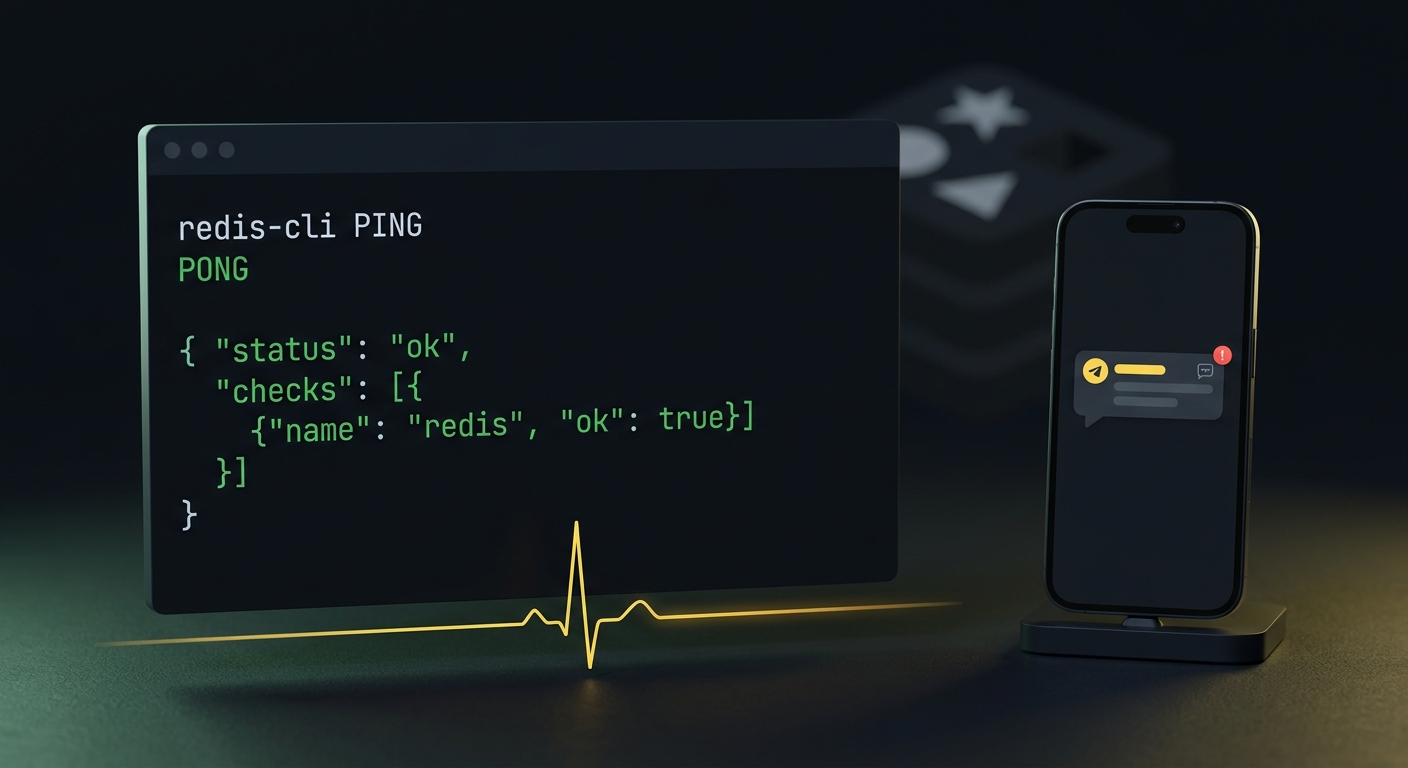
A Redis health check should answer one question: can my app actually talk to Redis right now? Not "is the redis process running" (it can be running and refusing connections), and not "did it answer an hour ago." The fastest check is redis-cli ping, which returns PONG when the server is able to serve data. But a ping you run by hand, or a healthcheck that only lives inside your Docker host, tells you nothing when Redis falls over at 3am and you're asleep.
So there are really three layers here, and most guides only cover the first: the container-level healthcheck, the app-level readiness check, and the external monitor that pages a human. Let's build all three.
What does a Redis health check actually check?
PING is Redis's built-in liveness probe. Send it with no argument and a healthy server replies PONG:
redis> PING
PONG
That reply means more than "the socket is open." Redis returns an error to PING when it can't serve data, for example while it's still loading a large dataset from disk on startup, or when you're pointed at a stale replica that has lost sync. So a successful PONG is a genuine signal that Redis is ready to do work, not just that a process exists.
What PING does not tell you is whether your application can reach Redis. Your app talks to Redis over the network, through a connection pool, with credentials, possibly across a private network boundary. Redis can be perfectly healthy while your app can't reach it because of a wrong hostname, an expired password, a firewall rule, or an exhausted pool. That's the difference between a liveness check (is Redis itself alive) and a readiness check (can this app serve traffic that depends on Redis). You want both, in different places.
How do I add a health check to a Redis container in Docker Compose?
If Redis runs as a container, give it a healthcheck so Compose knows when it's actually ready, and so dependent services wait for it instead of crash-looping on startup:
services:
  redis:
    image: redis:7-alpine
    healthcheck:
      test: ["CMD", "redis-cli", "ping"]
      interval: 10s
      timeout: 3s
      retries: 3
      start_period: 5s

  api:
    build: .
    depends_on:
      redis:
        condition: service_healthy
The four knobs are worth understanding, because the defaults are rarely what you want:
- interval is how often the check runs. 10s is a reasonable cadence for a dependency.
- timeout is how long a single check may take before it counts as a failure. Keep it short (a few seconds); a
PINGthat takes 3 seconds is already a problem. - retries is how many consecutive failures flip the container to
unhealthy. This is your damping against a single flaky check. - start_period is a grace window at boot during which failures don't count, so a slow-loading Redis doesn't get marked unhealthy before it's finished warming up.
The depends_on block with condition: service_healthy is the part that saves you real pain: your api service won't start until Redis reports healthy, which kills the classic "app boots, Redis isn't ready, app dies" race.
If Redis requires a password (requirepass), an unauthenticated ping fails with a NOAUTH error, so pass the credential and match the reply explicitly:
    healthcheck:
      test: ["CMD-SHELL", "redis-cli -a \"$REDIS_PASSWORD\" ping | grep -q PONG"]
Keep that password in an environment variable rather than hard-coding it. You can watch the results locally with docker inspect --format '{{json .State.Health}}' <container>.
How do I check Redis from my app's readiness endpoint?
The container healthcheck proves Redis is up. It says nothing about whether your app can reach it. For that, add a Redis check to a readiness endpoint your app already exposes (call it /readyz to keep it distinct from a shallow liveness /healthz).
Two rules make this check safe. First, bound it with a timeout so a hung Redis can't hang your health endpoint and take the whole app down with it. Second, return machine-parseable JSON with a top-level status and a per-dependency checks array, plus a real HTTP status code, so any monitor can read it without scraping HTML.
Here it is in Node with ioredis and Express:
// GET /readyz — deep readiness: can THIS app reach Redis right now?
app.get('/readyz', async (req, res) => {
  const checks = []
  try {
    // race the PING against a 500ms timeout so a stuck Redis can't wedge us
    const pong = await Promise.race([
      redis.ping(),
      new Promise((_, reject) =>
        setTimeout(() => reject(new Error('redis timeout')), 500)),
    ])
    checks.push({ name: 'redis', status: pong === 'PONG' ? 'ok' : 'down' })
  } catch (err) {
    checks.push({ name: 'redis', status: 'down' })
  }

  const ok = checks.every((c) => c.status === 'ok')
  res.status(ok ? 200 : 503).json({ status: ok ? 'ok' : 'down', checks })
})
The same shape in Python, with redis-py and a socket timeout doing the bounding for you:
import redis

r = redis.Redis(host="localhost", port=6379, socket_timeout=0.5)

@app.get("/readyz")
def readyz():
    checks = []
    try:
        r.ping()  # raises redis.RedisError on failure or timeout
        checks.append({"name": "redis", "status": "ok"})
    except redis.RedisError:
        checks.append({"name": "redis", "status": "down"})

    ok = all(c["status"] == "ok" for c in checks)
    return ({"status": "ok" if ok else "down", "checks": checks},
            200 if ok else 503)
A healthy response looks like this, and it's small enough that any uptime monitor can parse it in a millisecond:
HTTP/1.1 200 OK
Content-Type: application/json

{"status":"ok","checks":[{"name":"redis","status":"ok"}]}
When Redis is unreachable, the same endpoint returns 503 with "status":"down" and the redis check marked down. That is the signal an external monitor keys off of.
Should Redis being down fail the whole health check?
Not always, and this is the nuance most examples skip. Ask whether Redis is a hard dependency:
- Hard dependency (session store, rate limiter, primary cache with no fallback): if Redis is down your app can't correctly serve requests, so return
503. Traffic and monitors should both treat you as down. - Soft dependency (best-effort cache you can miss and fall back to the database): don't take the whole app down because a cache blinked. Return
200with"status":"degraded"and achecksentry showingredisisdown.
A degraded response lets you keep serving while still raising a flag. If your monitor understands a degraded state, it can warn you without paging you out of bed. CanaryHub's probe, for instance, reads that {status, checks} payload directly: a down status or a non-2xx code is an outage, a degraded status surfaces the specific failing check by name so the alert tells you what broke, not just that something did.
Why doesn't a passing health check mean Redis is monitored?
Here's the trap. A Docker healthcheck runs inside your infrastructure. When it fails, Docker (or your orchestrator) restarts the container. That's useful, but it is not monitoring, because nobody outside the box is watching, and nobody gets told. If the whole host goes down, or Redis enters a restart loop, or the network partitions, the local healthcheck is either gone or lying, and you find out from your users.
A health endpoint is inert until something external polls it. The endpoint you built in the last section returns a clean 503 when Redis is unreachable, but a 503 that nobody reads is just a log line. The missing piece is an external monitor that hits /readyz on a schedule, from outside your network, and pages you the moment it sees the failure.
That's the whole job: point an uptime monitor at your readiness URL, tell it to expect a 2xx, and route the alert somewhere you'll actually see it. With CanaryHub that's a Telegram (or Slack, or email) alert the moment /readyz starts returning 503, with the failing redis check named in the message. The check you already wrote does the detecting; the external monitor does the telling. You need both.
How do I catch a Redis-backed worker that died?
Redis is almost never just a cache. It's the backbone of your background jobs: Sidekiq stores all of its job and operational data in Redis, and Celery, BullMQ, and RQ all lean on it the same way. Which creates a blind spot that a /readyz check will never catch.
Your web process pings Redis, gets PONG, and reports healthy. Meanwhile the worker process, the thing that actually drains the queue, has crashed. Redis is up. The web app is up. /readyz is green. And jobs are silently piling up because nothing is processing them. Your health check is telling the truth and still missing the incident, because it's checking the wrong process.
The failure mode here is absence, not error, and you can't catch absence by polling an endpoint. You catch it with a heartbeat, also called a dead man's switch: the worker reports in on every run, and you alert when a report is late. Add one line to the end of the worker's recurring task, after it has actually done its work:
# at the end of the worker's scheduled run, after the queue is drained
curl -fsS -m 10 --retry 3 https://ingest.canaryhub.ai/ping/YOUR_TOKEN
Configure the monitor with the interval you expect (say, a ping every 5 minutes) plus a grace period. As long as the pings keep landing, it stays quiet. The moment one is late, it assumes the worker died and alerts you. Now a green /readyz and a dead Sidekiq can't hide from you at the same time.
The whole picture
A complete Redis health check is three layers, each covering the previous one's blind spot:
- A container healthcheck (
redis-cli ping) so your orchestrator knows Redis is ready and dependents wait for it. - An app readiness endpoint with a bounded Redis PING returning
{status, checks}JSON, so any monitor can tell whether your app can reach Redis. - An external monitor on that endpoint, plus a heartbeat on every Redis-backed worker, so a human actually gets paged, for both "Redis is down" and "the worker that uses Redis is down."
Get all three in place and the 3am Redis outage becomes a Telegram message you can act on, instead of a support ticket you read over breakfast. If cron jobs and background workers are where your risk really lives, the same heartbeat pattern is worth a closer look in our guide to monitoring a cron job with a dead man's switch.