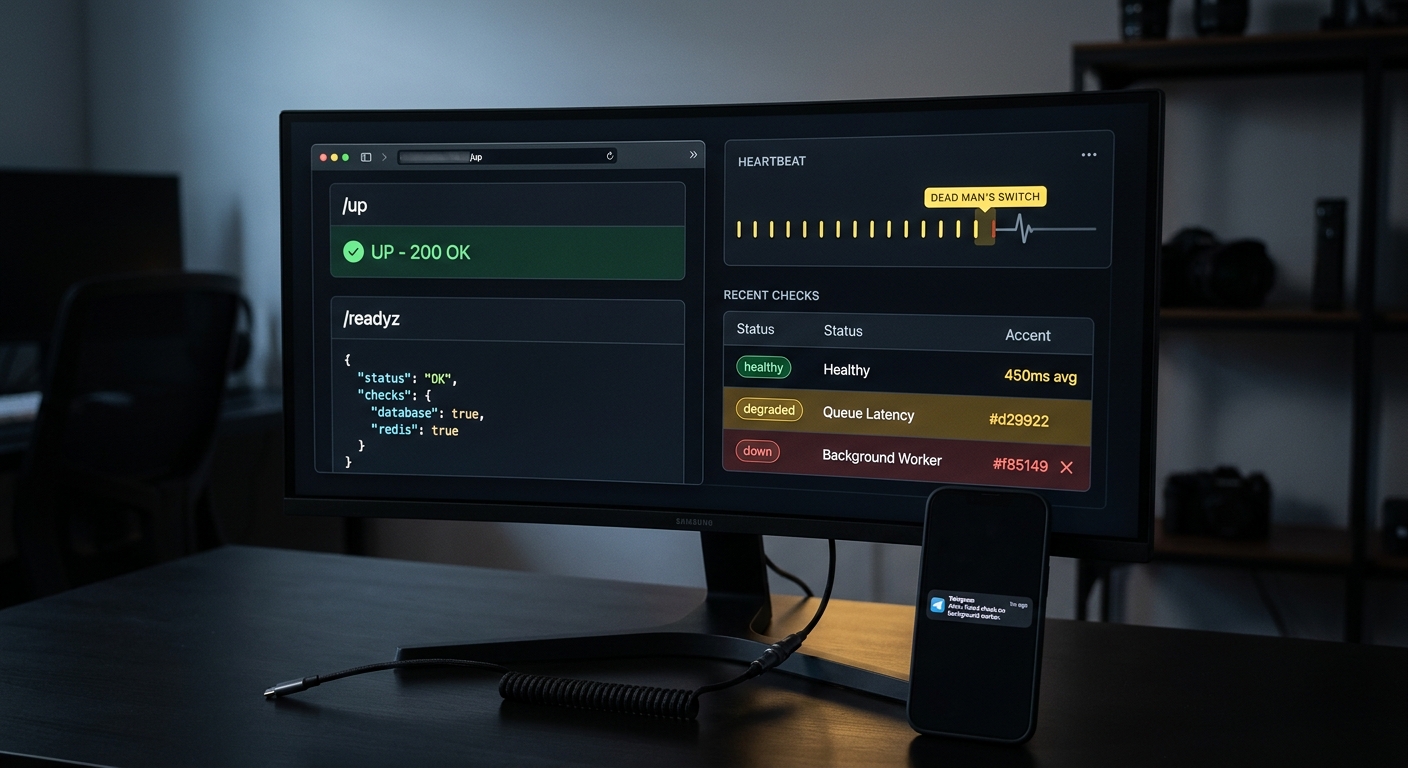
Rails 7.1 gave you a health check for free. Run rails new on 7.1 or later and config/routes.rb already contains get "up" => "rails/health#show", so /up is live before you write a line of code. It answers exactly one question: did the app boot without raising? Green means the process is up, red means it isn't, and that is genuinely useful for a load balancer deciding whether to send traffic. It is also where most guides stop, which leaves two holes big enough to sleep through an outage.
What is the Rails health check endpoint?
/up maps to Rails::HealthController#show. The action does almost nothing on purpose: it calls render_up, which returns a small page with a green background and HTTP 200. Ask for JSON and you get { "status": "up", "timestamp": "..." }. The controller wraps the whole thing in rescue_from(Exception), so if anything raises during the request it calls render_down instead, which returns a red page (or { "status": "down" }) with HTTP 500.
That is the entire contract. A 200 from /up means the Rails process started, loaded your code, and can render a response. It does not mean your app can serve a real request.
The controller's own documentation is blunt about the boundary:
This endpoint does not reflect the status of all of your
application's dependencies, such as the database or Redis cluster.
Replace "rails/health#show" with your own controller action if
you have application specific needs.
So the built-in check is a liveness signal, not a readiness one. Worth knowing before you point anything important at it.
How do I silence /up in the production logs?
Once something polls /up every few seconds, your logs fill with Started GET "/up" noise. Rails 8 added a config for exactly this:
# config/environments/production.rb
config.silence_healthcheck_path = "/up"
That routes the path through Rails::Rack::SilenceRequest and drops its log lines. (If you saw config.silence_healthcheck written somewhere without the _path, that's wrong. The real option name ends in _path.) On Rails 7.1 or 7.2 you don't have this setting yet, so silence it at the Rack or reverse-proxy layer instead.
Does /up check the database?
No, and you should not make it. It is tempting to have your health check open a database connection so a dead Postgres shows up as unhealthy. The problem is what a load balancer or orchestrator does with that answer: it pulls the instance out of rotation or restarts it. Tie your liveness probe to a shared dependency and one slow database takes down every app server at once, each of them reporting unhealthy and getting cycled while the real problem is elsewhere. The Rails docs warn about this directly, noting the endpoint can "lead to situations where your application is being restarted due to a third-party service going bad."
The fix is not to cram dependency checks into /up. It is to keep /up shallow and add a separate endpoint that goes deep.
How do I add a readiness check that verifies the database and Redis?
Write your own action that actually exercises the dependencies a real request needs, and return machine-readable JSON so a monitor can parse it. Route it somewhere distinct like /readyz:
# config/routes.rb
Rails.application.routes.draw do
  get "up"     => "rails/health#show", as: :rails_health_check  # liveness (built-in)
  get "readyz" => "readiness#show"                              # readiness (yours)
end
# app/controllers/readiness_controller.rb
class ReadinessController < ActionController::Base
  def show
    checks  = { database: check_database, redis: check_redis }
    healthy = checks.values.all? { |c| c[:status] == "ok" }

    render json: { status: healthy ? "ok" : "down", checks: checks },
           status: healthy ? :ok : :service_unavailable
  end

  private

  def check_database
    ActiveRecord::Base.connection.execute("SELECT 1")
    { status: "ok" }
  rescue => e
    { status: "down", error: e.class.name }
  end

  def check_redis
    redis = Redis.new(timeout: 1)
    redis.ping == "PONG" ? { status: "ok" } : { status: "down" }
  rescue => e
    { status: "down", error: e.class.name }
  ensure
    redis&.close
  end
end
A ready app returns 200 and this body:
{
  "status": "ok",
  "checks": {
    "database": { "status": "ok" },
    "redis":    { "status": "ok" }
  }
}
When Postgres is unreachable, the same shape comes back with status: "down" and HTTP 503 Service Unavailable, which is the conventional code for "alive but not ready to serve." (The built-in /up uses 500 for its boot failure; your readiness endpoint should use 503, so a monitor can tell "app is broken" from "a dependency is down.")
One detail that separates a readiness check that helps from one that hurts: bound it. A plain SELECT 1 against a wedged database can hang for as long as your connection timeout allows, and your readiness endpoint hangs with it. Set a short statement_timeout on the connection (or a low connect_timeout in database.yml) so a stuck dependency returns 503 in a second or two instead of piling up hung requests. The Redis.new(timeout: 1) above does the same job for Redis.
Liveness or readiness: which one should the load balancer hit?
Point the load balancer or platform health check at /up. You want it to answer "is this process alive and worth sending traffic to," and you specifically do not want a transient database blip to make every instance fail its liveness check and get restarted.
Point your external uptime monitor at /readyz. That is the check that should page a human, because a 503 there means requests are failing for real reasons: the database is down, Redis is unreachable, a migration left the app in a bad state. Two endpoints, two audiences, two different failure responses.
What actually pages you when a check fails?
Here is the hole nobody mentions: a health endpoint is inert. /readyz can return 503 for an hour and Rails will not tell you. It sits there and waits to be asked. Something outside your app has to poll it on a schedule, notice the failure, and reach you. Without that, you have written a very tidy status page that only you and your load balancer ever read.
That external poller is the actual monitor. It hits /readyz every minute from outside your infrastructure (so it also catches the case where the whole box is unreachable, which no in-process check can report), parses the { status, checks } JSON, and pings your phone the moment it flips to down. CanaryHub does this and sends the alert to Telegram by default, which is handy at 3am when you are not looking at a dashboard. Any monitor that reads a JSON body and understands 503 works; the point is that the endpoint alone is not monitoring.
How do you catch a background job that quietly died?
Your /readyz check is blind to your workers. A Sidekiq process, a Solid Queue supervisor, or a whenever-scheduled rake task can crash or hang while the web app stays perfectly green, because the job runs in a different process that never touches your controllers. The failure mode is silence: the nightly export just stops running, and nothing returns an error because nothing ran.
You catch absence with a heartbeat, also called a dead man's switch. The job pings a unique URL when it finishes successfully; if that ping is late or missing, the monitor assumes the job died and alerts you. In a Rails job that is one line:
class DailyExportJob < ApplicationJob
  def perform
    # ... the real work ...

    require "net/http"
    Net::HTTP.get(URI("https://ingest.canaryhub.ai/ping/YOUR_TOKEN"))
  end
end
Or straight from crontab, guarded so the ping only fires when the command succeeds:
0 3 * * * cd /app && bin/rails runner 'DailyExport.run' && curl -fsS -m 10 "https://ingest.canaryhub.ai/ping/YOUR_TOKEN"
The && matters: if the rake task exits non-zero, the curl never runs, the ping never lands, and the missing heartbeat is the alert. That is the whole trick, and it is covered end to end in how to monitor a cron job.
The short version
/up is a good liveness probe and a lousy monitor. Keep it for your load balancer, add a /readyz that checks the database and Redis and returns { status, checks } JSON with a 503 when something is down, point an external monitor at that readiness endpoint so a human actually gets paged, and give every background job a heartbeat so silence turns into an alert instead of a surprise. The endpoint tells you the truth; it just needs something on the outside listening for it.