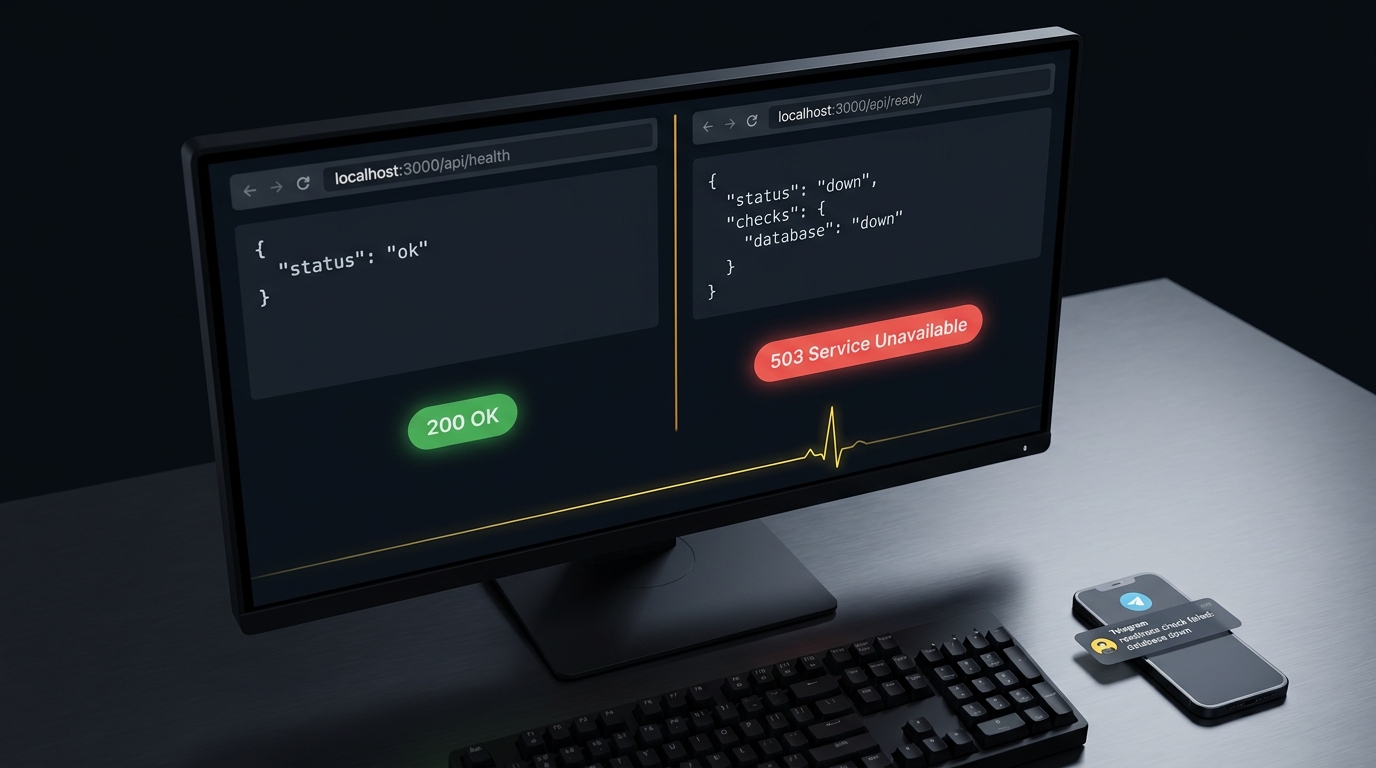
Next.js does not give you a health check endpoint. There is no /up, no /actuator/health, nothing built in. You add one with a Route Handler, and the whole thing is about ten lines. The part people get wrong is what the endpoint should actually check, and the fact that an endpoint sitting in your app does nothing until something outside your app calls it and pages you when it fails.
Here is the short version: expose a shallow /api/health that returns 200 whenever the server can answer a request, expose a separate /api/ready that runs a bounded database query and returns 503 when a dependency is down, and mark both dynamic = 'force-dynamic' so Next never caches them. Then have something external poll /api/ready on a schedule.
Does Next.js have a built-in health check?
No. This trips people up because so many frameworks ship one. Spring Boot has Actuator, Rails 7.1+ generates /up, NestJS has Terminus. Next.js has none of that, which is why "how do I add a health check to Next.js" is a question people keep asking on Stack Overflow and in the Vercel GitHub discussions.
You build it yourself. In the App Router it is a Route Handler:
// app/api/health/route.ts
export const dynamic = 'force-dynamic' // never cache a health check
export const runtime = 'nodejs'

export async function GET() {
  return Response.json({ status: 'ok' }, { status: 200 })
}
In the Pages Router it is an API route:
// pages/api/health.ts
import type { NextApiRequest, NextApiResponse } from 'next'

export default function handler(_req: NextApiRequest, res: NextApiResponse) {
  res.status(200).json({ status: 'ok' })
}
That is a liveness check: it returns 200 as long as the Node process is running and can serve a request. Useful, but on its own it is also where the trouble starts.
Why does my Next.js health check return 200 when the app is broken?
Because a bare { status: 'ok' } can only fail in one way: the process is dead. Your database connection pool can be exhausted, a required environment variable can be missing, an upstream API you depend on can be timing out, and that endpoint still cheerfully returns 200. It is answering "am I running", not "can I do my job".
There is a second, sneakier reason, and it is specific to Next.js. Route Handlers changed their caching default between versions. In the official docs, the route.js version history reads: as of v15.0.0-RC, "the default caching for GET handlers was changed from static to dynamic." On Next.js 14, a GET handler with no dynamic signals could be prerendered at build time and served as a static asset, which means your health route returns the exact 200 it captured during next build, forever, even while production is on fire. On Next.js 15 and later it defaults to dynamic, but a CDN or revalidate config can still cache a response in front of it.
export const dynamic = 'force-dynamic' closes that hole on every version. Belt and suspenders, add a no-store header when you build the response for a deep check:
return Response.json(body, {
  status: ok ? 200 : 503,
  headers: { 'Cache-Control': 'no-store' },
})
So the fix is two parts: never cache the route, and make it do real work so it can actually fail.
Liveness vs readiness: which one should Next.js expose?
Both, at different paths, because they answer different questions.
- Liveness (
/api/health): is the process alive and serving? Cheap, no dependencies, always 200 if the server can respond. This is what a container or orchestrator probe should hit. - Readiness (
/api/ready): can the app serve real traffic right now? Checks the things a request needs, database, cache, critical upstreams, and returns 503 if any of them are down. This is what an external monitor should hit.
Keeping them separate matters. If you put the deep readiness check on your Docker or Kubernetes liveness probe, a two-second database hiccup makes the orchestrator conclude the container is dead and restart it. Now you are cycling healthy containers during a database blip, turning a minor wobble into a restart storm. Liveness stays shallow on purpose.
Here is a readiness route with a bounded database check. The bound is the point: a naive await db.query('SELECT 1') against a hung connection pool can itself hang for as long as your platform's request timeout, so the health check becomes another thing that is down. Race it against a timeout.
// app/api/ready/route.ts
import { db } from '@/lib/db' // your Postgres/Prisma/Drizzle client

export const dynamic = 'force-dynamic'
export const runtime = 'nodejs' // a DB driver won't run on the edge runtime

const TIMEOUT_MS = 2000

function withTimeout<T>(p: Promise<T>, ms: number): Promise<T> {
  return Promise.race([
    p,
    new Promise<T>((_, reject) =>
      setTimeout(() => reject(new Error('timeout')), ms),
    ),
  ])
}

export async function GET() {
  const checks: Record<string, 'ok' | 'down'> = {}
  let healthy = true

  try {
    await withTimeout(db.query('SELECT 1'), TIMEOUT_MS)
    checks.database = 'ok'
  } catch {
    checks.database = 'down'
    healthy = false
  }

  return Response.json(
    { status: healthy ? 'ok' : 'down', checks },
    {
      status: healthy ? 200 : 503,
      headers: { 'Cache-Control': 'no-store' },
    },
  )
}
A few things worth calling out:
runtime = 'nodejs'. Most database drivers cannot run on the edge runtime. Keep the readiness route on Node. (Edge is now deprecated as a route runtime value anyway.)- The 503. Return an actual
503 Service Unavailableon failure, not a 200 with{ ok: false }. Monitors, load balancers, and orchestrators read the status code, not your JSON. - The
{ status, checks }shape. A machine-readable body means whatever polls the endpoint can log exactly which dependency failed instead of just "not 200". CanaryHub, for one, parses a{ status, checks }payload so a down alert can name the failing dependency. - Keep it fast and cheap. A readiness check runs often.
SELECT 1with a timeout, not a table scan.
How do I add a Docker health check for a self-hosted Next.js app?
If you self-host with output: 'standalone', Next.js produces a minimal .next/standalone/server.js you run with node server.js, no node_modules needed. That is the usual container setup, and it is exactly where a HEALTHCHECK earns its place. Point it at the shallow liveness route:
# ... after next build with output: 'standalone' in next.config.js
HEALTHCHECK --interval=30s --timeout=3s --start-period=20s --retries=3 \
  CMD wget -qO- http://localhost:3000/api/health || exit 1
Point the container probe at /api/health, not /api/ready, for the restart-loop reason above: Docker restarts the container when the healthcheck fails, and you do not want a database blip triggering restarts. If your base image has neither wget nor curl (a slim Node image often won't), swap in a one-line Node fetch:
HEALTHCHECK --interval=30s --timeout=3s --start-period=20s --retries=3 \
  CMD node -e "fetch('http://localhost:3000/api/health').then(r=>process.exit(r.ok?0:1)).catch(()=>process.exit(1))"
The Docker healthcheck restarts a wedged container. It does not text you. That is a different job.
Do I even need a health check on Vercel?
Less than you would think, and this is the part most guides skip. On Vercel, your app runs as serverless functions, not a long-lived process. There is no server to be "down" in the way there is on a box or in a container. A /api/health route that returns 200 mostly tells you that Vercel can cold-start a function, which it almost always can. It will not tell you that your database is unreachable from that function's region, or that a background job stopped running.
On a serverless deploy, two things matter more than a self-poll:
- Monitor your real routes from outside. Have an external checker hit an actual page or API route that touches your dependencies, from outside Vercel, so you learn about a broken deploy the way a user would.
- Watch the jobs that run without a request. Which brings us to the failure mode nobody's
/api/healthcan see.
How do I get paged when the endpoint fails or a cron job doesn't run?
Here is the thing every code snippet above quietly ignores: an endpoint does nothing until something calls it. /api/ready can return a perfect 503 the moment your database dies, and if nothing is polling it, you find out from an angry customer. The endpoint is the sensor. You still need the alarm.
So the last step is an external monitor that polls /api/ready on an interval, reads the status code, and pings you (Telegram, Slack, email) the moment it goes 503 or stops responding. External is the operative word: a monitor running inside the same Vercel project or the same container goes down with it.
And then there are the jobs that never touch /api/health at all. If you use Vercel Cron, your vercel.json schedules a GET to a route:
{
  "crons": [{ "path": "/api/cron/cleanup", "schedule": "0 3 * * *" }]
}
Read the Vercel docs closely and two facts jump out. First, "Vercel will not retry an invocation if a cron job fails." Second, delivery is best-effort: "occasional transient network errors can prevent a request from reaching your function. In those cases, your function does not execute, and no runtime log is created for that scheduled run." No retry, no alert, and a missed run that leaves no log behind. On the Hobby plan a cron also only runs once per day and can fire anytime within its scheduled hour. Your nightly cleanup can quietly stop running and nothing will tell you.
A green /api/health is blind to all of this, because the cron job's failure is an absence, not an error. The fix is a dead man's switch: have the job ping a monitor after it finishes its real work, and have that monitor alert you when the ping is late.
// app/api/cron/cleanup/route.ts
import type { NextRequest } from 'next/server'

export const dynamic = 'force-dynamic'

export async function GET(request: NextRequest) {
  // Vercel sends CRON_SECRET as a Bearer token; reject anything else.
  if (request.headers.get('authorization') !== `Bearer ${process.env.CRON_SECRET}`) {
    return new Response('Unauthorized', { status: 401 })
  }

  await runCleanup() // your real work

  // Only reached if the work above succeeded: the dead man's switch.
  await fetch('https://ingest.canaryhub.ai/ping/YOUR_TOKEN')

  return Response.json({ ok: true })
}
If the job runs and succeeds, the ping lands and the monitor stays quiet. If the deploy breaks it, the database is down when it runs, or Vercel never invokes it at all, the ping never arrives, and the monitor alerts you on silence. That is the one failure mode a request-driven health check structurally cannot catch, and it is where a lot of "the backup hasn't run in three weeks" incidents come from.
Putting it together
A complete health story for a Next.js app is three pieces, not one:
/api/health(shallow liveness,force-dynamic): for your container or platform probe. Restarts a dead process./api/ready(deep readiness, bounded checks, 503 on failure): for an external monitor. Tells you a dependency is down before your users do.- A heartbeat on every scheduled job: for the failures that are silence, not errors.
The endpoints are easy. The discipline is remembering that none of them page anyone by themselves. If you want the alerting half handled, CanaryHub polls a /api/ready endpoint, reads its { status, checks } body, and does heartbeat monitoring for cron jobs, then pings you on Telegram or Slack the moment something goes quiet. If you are wiring up scheduled jobs, the dead man's switch pattern is worth reading next.