Cron will run your job at 3am forever. A health check endpoint has the opposite problem: it will happily return 200 OK while your database connection pool is exhausted and every real request is timing out. A route that only answers "the web server is accepting connections" is technically a health check and practically useless.
A health check endpoint is an HTTP route, usually /health, that returns 200 when your app and its critical dependencies are working and 503 when they aren't. The useful part is which dependencies it checks and what it does with the result. This walks through what to check, which status code to return, what the response body should look like, and paste-ready endpoints for Express, FastAPI, and Go.
What should a health check endpoint actually check?
The failure you want to catch is the one where the process is running but the app can't do its job. The web server answering the socket proves almost nothing. So a health check should verify the dependencies that, if broken, make your app broken:
- The database. A cheap query like
SELECT 1confirms the connection pool can hand out a live connection, not just that the config points somewhere. - The cache or queue you can't function without, if losing it means requests fail rather than just slow down.
- Critical downstream APIs, but carefully. Check that you can reach a payment provider or auth service if your app is dead without it. Do not check every third-party integration, or their bad day becomes your outage.
The line to hold: check what makes you unhealthy, not everything you touch. A geocoding service being down for a minute does not mean your app should get pulled out of the load balancer. If a request can still succeed without a dependency, that dependency does not belong in the gate that decides whether you're up.
What status code should a health check return?
Two codes carry the whole contract, and monitors and load balancers key off them:
- 200 OK means the app is healthy and should receive traffic.
- 503 Service Unavailable means it can't do its job right now. Load balancers and orchestrators pull a 503 instance out of rotation, and an external monitor should alert on it.
That is the entire status-code story for the common case. Do not get clever with 500 (that reads as "the health check itself crashed"), and do not return 200 with {"status": "down"} in the body, because most tooling only looks at the code and will think you're fine.
The nuance is the degraded state. If a non-critical dependency is slow but requests still succeed, keep returning 200 and note the degradation in the body. Save 503 for "genuinely cannot serve," because a 503 has consequences: it can take a working instance offline over a dependency that was only mildly unhappy.
What does a good /health response look like?
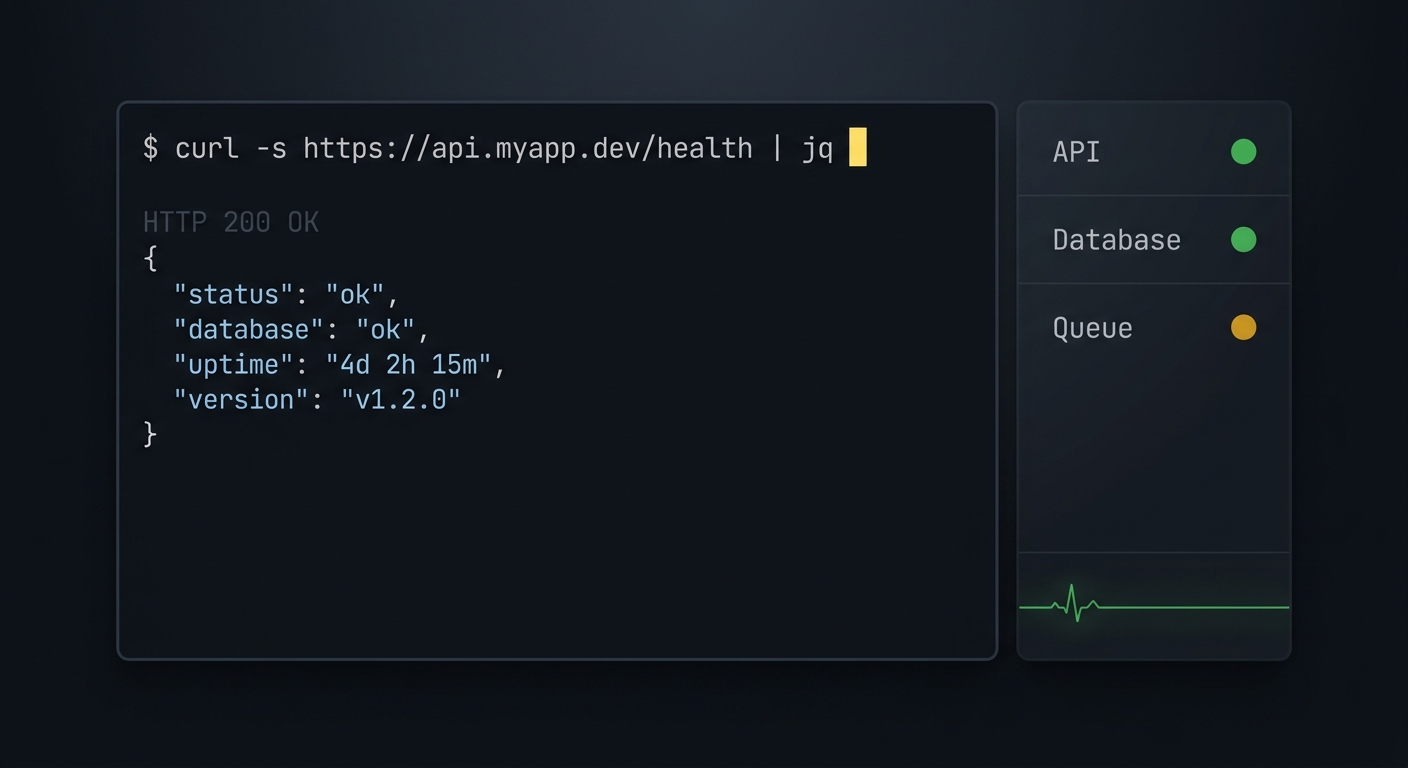
Return the status code as the machine-readable answer and a small JSON body as the human-readable one. Name each check so that when you're paged at 3am, the response tells you what broke without a second lookup:
{
  "status": "ok",
  "checks": {
    "database": "ok",
    "redis": "ok",
    "stripe": "ok"
  },
  "uptime": 84213,
  "version": "a1b2c3e"
}
When something is wrong, flip the offending check and the code together:
{
  "status": "degraded",
  "checks": {
    "database": "failed",
    "redis": "ok",
    "stripe": "ok"
  },
  "uptime": 84213,
  "version": "a1b2c3e"
}
The version field (a git SHA or release tag) is the highest-value line in there. When a monitor tells you the endpoint went red at 02:14, the version answers "was there a deploy right before?" faster than digging through CI. Keep the body under a few hundred bytes and never put a stack trace or raw error string in it.
Liveness vs readiness: do you need two endpoints?
This is the distinction the generic guides skip, and getting it wrong causes restart loops.
- Liveness answers "is this process alive, or is it wedged and should be killed?" It must be shallow. It touches no dependencies. It returns 200 as long as the event loop is turning.
- Readiness answers "should this instance receive traffic right now?" It's the deep check that pings the database and friends.
Here's why the split matters. In Kubernetes a failing liveness probe restarts the container, and a failing readiness probe removes it from the load balancer. If your liveness probe checks the database and the database has a blip, Kubernetes will restart every one of your pods at once, turning a recoverable dependency outage into a full outage of your own making. Deep checks belong in readiness. Liveness stays dumb on purpose.
If you're not on Kubernetes, on a single VM or a platform like Fly.io or Heroku, you can often get away with one /health that does the deep check. Just understand which job it's doing. When you add an orchestrator later, split it into a shallow /healthz and a deep /readyz.
How do you build one? (Express, FastAPI, Go)
Same shape in every language: try the dependency checks, collect the results, return 200 or 503 with a small body. Here's Express with a Postgres pool:
import express from "express";
import { pool } from "./db.js";

const app = express();

app.get("/health", async (_req, res) => {
  const checks = {};
  let healthy = true;

  try {
    await pool.query("SELECT 1");
    checks.database = "ok";
  } catch {
    checks.database = "failed";
    healthy = false;
  }

  res.status(healthy ? 200 : 503).json({
    status: healthy ? "ok" : "degraded",
    checks,
    uptime: Math.floor(process.uptime()),
    version: process.env.GIT_SHA ?? "dev",
  });
});
FastAPI, with a SQLAlchemy engine:
from fastapi import FastAPI, Response
from sqlalchemy import text
from .db import engine

app = FastAPI()

@app.get("/health")
def health(response: Response):
    checks = {}
    healthy = True

    try:
        with engine.connect() as conn:
            conn.execute(text("SELECT 1"))
        checks["database"] = "ok"
    except Exception:
        checks["database"] = "failed"
        healthy = False

    response.status_code = 200 if healthy else 503
    return {"status": "ok" if healthy else "degraded", "checks": checks}
Go, with the standard library and a *sql.DB. Note the context timeout so a hung database can't hang the health check itself:
func healthHandler(db *sql.DB) http.HandlerFunc {
	return func(w http.ResponseWriter, r *http.Request) {
		ctx, cancel := context.WithTimeout(r.Context(), 2*time.Second)
		defer cancel()

		status, code := "ok", http.StatusOK
		checks := map[string]string{"database": "ok"}

		if err := db.PingContext(ctx); err != nil {
			checks["database"] = "failed"
			status, code = "degraded", http.StatusServiceUnavailable
		}

		w.Header().Set("Content-Type", "application/json")
		w.WriteHeader(code)
		json.NewEncoder(w).Encode(map[string]any{"status": status, "checks": checks})
	}
}
The timeout matters in every language, not just Go. If your database is unreachable, an unbounded check can sit there until the client gives up, and the monitor records a slow timeout instead of a clean 503. Bound every dependency check to a second or two so the endpoint always answers quickly, even to say "I'm broken."
If you're on a framework with a batteries-included option, use it: Spring Boot's Actuator exposes /actuator/health, and ASP.NET Core ships health-check middleware with built-in liveness and readiness support. They implement most of this correctly out of the box.
How often should it get checked, and by what?
A health check that nothing polls is a log line nobody reads. Three things typically hit it:
- Load balancers and orchestrators, every few seconds, to decide routing. They only care about the status code.
- An external uptime monitor, on an interval like every 30 to 60 seconds, from outside your infrastructure, to alert a human when the endpoint stops returning 200 or gets slow.
- You, with curl, when you're debugging:
curl -s -o /dev/null -w "%{http_code}\n" https://api.myapp.dev/health
# 200

curl -s https://api.myapp.dev/health | jq
Because so many pollers hit it, cache the deep result. Run the dependency checks on a short timer, store the outcome, and have the route serve the cached value:
let cached = { status: "ok", checks: {}, at: 0 };

async function refreshHealth() {
  const checks = {};
  let healthy = true;
  try {
    await pool.query("SELECT 1");
    checks.database = "ok";
  } catch {
    checks.database = "failed";
    healthy = false;
  }
  cached = { status: healthy ? "ok" : "degraded", checks, at: Date.now() };
}

setInterval(refreshHealth, 5000);
refreshHealth();

app.get("/health", (_req, res) => {
  res.status(cached.status === "ok" ? 200 : 503).json(cached);
});
Now a load balancer polling every 5 seconds and a monitor polling every 30 don't collectively run a query per hit. You still detect an outage within a few seconds, and /health stops being one of the busiest database clients in your app.
The external monitor is where the design pays off. An uptime monitor sits outside your servers, requests /health on a schedule, and pings you the moment it stops seeing 200 or the response time climbs. That only works if your endpoint tells the truth: if it returns 200 while the database is down, the monitor stays quiet and your users find the outage first. Build the endpoint so a 503 means "wake me up," point a monitor at it, and the box that's up-but-broken becomes an alert instead of a support ticket. CanaryHub is one such monitor, and it will text you on Telegram the second your /health goes red, but any external check works as long as the endpoint is honest.
How do you keep a health check endpoint secure?
The detailed body is a small map of your architecture. "stripe": "ok" tells a stranger you take payments through Stripe. Version strings hand out a CVE-matching shortcut. So:
- Keep the public endpoint minimal. A bare 200 or 503 with no body, or a body with just
{"status":"ok"}, is safe to expose to load balancers and monitors. - Gate the detailed body behind a token, a header, or your internal network. A second route like
/health/detailthat requires auth is a clean split. - Never leak internals. No stack traces, no raw exception messages, no internal hostnames or connection strings in the response, even on the failure path.
- Watch the load. An unauthenticated deep check that queries the database on every request is a denial-of-service vector. Caching (above) closes it.
A good health check endpoint is a small thing you write once and rely on for years. Make it check what actually breaks, return the two status codes that tooling understands, keep the body honest and lean, and put something external in front of it that will tell you when it goes dark. If you want the "what to alert on" side of this, monitoring a cron job with a dead man's switch covers the same idea for the jobs that have no endpoint to poll.