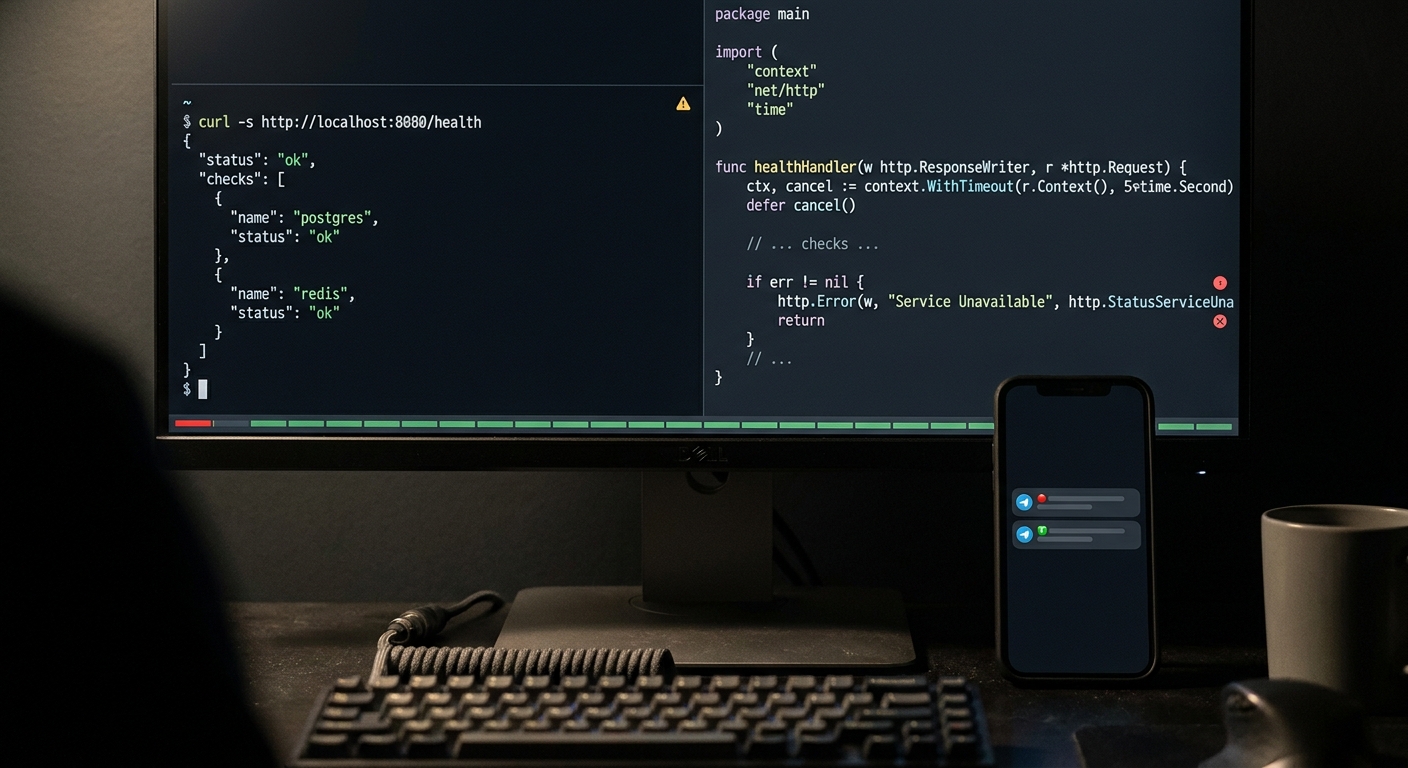
A health check in Go is an HTTP handler that answers one question honestly: can this service do its job right now? Return 200 when the answer is yes, 503 when it's no. The hard part isn't the handler. It's deciding what "doing its job" means, and making sure something is actually watching the answer.
Most Go health-check tutorials stop at a handler that returns 200 OK and call it done. That endpoint will happily report healthy while your database is unreachable, your queue consumer is dead, and your users are getting 500s. A health check that can't fail isn't a health check. It's a lie with a status code.
What is a health check in Go?
It's an HTTP endpoint your infrastructure hits on a schedule to decide two separate things:
- Should you keep this process alive, or restart it? That's a liveness check.
- Should you send this process traffic right now? That's a readiness check.
Those are different questions with different answers, and collapsing them into one /health route is the most common mistake. A process can be perfectly alive (no reason to restart it) while being temporarily unable to serve requests (its database connection is re-establishing). If your single health check reports that as "down," an orchestrator restarts a process that was about to recover on its own, and now you have a restart loop on top of a database blip.
So the mental model is two endpoints, or one endpoint with two modes:
- Liveness: cheap, no external calls. Is the goroutine scheduler running and the HTTP server answering? If this fails, the process is wedged and a restart is the right call.
- Readiness: checks the things a request actually needs: the database, a cache, a downstream API. If this fails, stop routing traffic here until it passes again.
How do I write a /health endpoint in Go?
Start with the standard library. You don't need a framework or a dependency for this.
package main

import (
	"encoding/json"
	"net/http"
)

type check struct {
	Name   string `json:"name"`
	Status string `json:"status"`
}

type response struct {
	Status string  `json:"status"`
	Checks []check `json:"checks,omitempty"`
}

func writeJSON(w http.ResponseWriter, code int, body response) {
	w.Header().Set("Content-Type", "application/json")
	w.WriteHeader(code)
	_ = json.NewEncoder(w).Encode(body)
}

// liveness: is the process up and serving? Nothing else.
func liveness(w http.ResponseWriter, r *http.Request) {
	writeJSON(w, http.StatusOK, response{Status: "ok"})
}
That's a working liveness probe. It does nothing but answer, which is exactly right: if the HTTP server can run this handler, the process is alive. Adding a database check here would be a bug, because a slow database would make your orchestrator think the process is dead and kill it.
The two constants that matter are http.StatusOK (200) and http.StatusServiceUnavailable (503). Return 200 when healthy, 503 when not. Don't get creative with 500 or 418: monitors and load balancers are built to read 2xx as up and everything else as down, and 503 specifically signals "temporarily unavailable, try again," which is what a failed readiness check means.
Liveness vs readiness: what should each one check?
Readiness is where the real checks live. This is where you reach out to your dependencies, with a timeout, and report exactly what's broken.
package main

import (
	"context"
	"database/sql"
	"net/http"
	"time"
)

func readiness(db *sql.DB) http.HandlerFunc {
	return func(w http.ResponseWriter, r *http.Request) {
		ctx, cancel := context.WithTimeout(r.Context(), 2*time.Second)
		defer cancel()

		status := "ok"
		code := http.StatusOK
		checks := []check{}

		if err := db.PingContext(ctx); err != nil {
			checks = append(checks, check{Name: "postgres", Status: "down"})
			status = "down"
			code = http.StatusServiceUnavailable
		} else {
			checks = append(checks, check{Name: "postgres", Status: "ok"})
		}

		writeJSON(w, code, response{Status: status, Checks: checks})
	}
}

func main() {
	var db *sql.DB // opened elsewhere with sql.Open

	mux := http.NewServeMux()
	mux.HandleFunc("/health", liveness)
	mux.Handle("/ready", readiness(db))
	http.ListenAndServe(":8080", mux)
}
Three details do the heavy lifting here:
context.WithTimeout. Never let a health check hang. If Postgres is wedged,db.PingContextshould give up after two seconds and report down, not block until the request times out somewhere upstream. A health check that hangs is worse than one that fails, because it turns into its own outage.db.PingContext(ctx)instead ofdb.Ping(). The context-aware variant respects the timeout.database/sqlpools connections, soPingContextverifies you can actually check out a usable one rather than only confirming the struct exists.- Report the failing check by name. The handler doesn't just flip to 503; it says which dependency is down. That's the difference between "readiness failed" and "postgres is down," and it's what turns your 3am pager into a five-second diagnosis.
For more dependencies, run them concurrently so one slow check doesn't serialize the rest. A sync.WaitGroup over a slice of check functions, each writing into its own slot, keeps the total time bounded by your slowest check rather than the sum. This is the point where a library like hellofresh/health-go starts to pay for itself, since it ships that concurrency and a consistent response shape out of the box. For one or two dependencies, the code above is enough.
What should the JSON body look like?
Keep it small and machine-parseable. A monitor is going to read this every 30 seconds, and a human is going to read it while something is on fire. Both want the same thing: a top-level status and a list of what failed.
{
  "status": "degraded",
  "checks": [
    { "name": "postgres", "status": "ok" },
    { "name": "redis", "status": "down" }
  ]
}
Three status values cover almost everything: ok, degraded, and down. Use degraded when the service can still handle core requests but something non-critical is impaired (your cache is down, so you're serving from Postgres and it's slower). Use down when a request can't be served at all. The distinction lets a monitor page you loudly for down and quietly note degraded, instead of treating every yellow light like a red one.
This exact shape is what an external monitor parses to tell you which dependency dragged the service down, instead of only that it's unhealthy. CanaryHub, for instance, reads a {status, checks} body like this one and surfaces the failing check's name straight into the alert, so "postgres down" lands on your phone instead of a bare "check failed."
Why doesn't my health check catch background job failures?
Because an HTTP /health endpoint can only report on things the HTTP request path touches. A background goroutine that panicked, a queue consumer that silently stopped pulling, a nightly cron that never fired: none of those move through your handler, so none of them show up in the response. Your /health says ok while half the system is dark.
This is a structural blind spot, not a bug you can fix by adding more checks to the endpoint. The web process can be perfectly ready to serve requests while the worker process next to it has been dead for six hours. Polling /health will never catch that, because there's nothing to poll. The failure mode is absence, and you can't GET an absence.
The fix is to invert it. Instead of something asking the job "are you ok?", the job reports in when it succeeds, and silence becomes the failure signal. That's a heartbeat, sometimes called a dead man's switch. In Go, it's one call at the end of the work:
func runNightlyJob(token string) error {
	if err := doTheActualWork(); err != nil {
		return err // ping never fires, so the monitor notices the silence
	}

	// Only reached on success. This line is the whole integration.
	_, err := http.Get("https://ingest.canaryhub.ai/ping/" + token)
	return err
}
Or for a job you run from cron rather than inside your Go binary, the same idea in one line, guarded so a failure upstream skips the ping:
0 3 * * * /usr/local/bin/backup && curl -fsS -m 10 https://ingest.canaryhub.ai/ping/YOUR_TOKEN
The monitor knows the job should check in every 24 hours. Miss the window past a grace period and it alerts you. No error code required, because "didn't run at all" doesn't produce one.
Who actually calls the endpoint?
This is the question the tutorials skip, and it's the one that decides whether any of the above matters. A health check no one polls is dead code that returns JSON.
Where the caller comes from depends on where you run:
- Kubernetes runs the checks for you. The kubelet hits your
livenessProbeandreadinessProbeon a schedule, restarts pods that fail liveness, and pulls pods that fail readiness out of the Service endpoints. If you're on k8s, wiring the two handlers above into the probe config is most of the job. - Fly.io can poll a check you declare in
fly.tomlunder[[http_service.checks]]with apath,interval, andtimeout. But Fly uses the result to decide routing and load balancing, not to page you: a machine that fails checks stops receiving traffic, which is good for your users and invisible to you. - A plain VPS, a Heroku dyno, or a single container has nothing polling your endpoint by default. You wrote a perfect
/readyhandler and absolutely nothing is calling it.
That last case is the common one for indie and solo-dev deploys, and it's the trap. The health check reports down, the load balancer (if any) reroutes, and you never find out until a user emails you. Even on Kubernetes and Fly, the platform's reaction is to reroute or restart, which keeps the site up but tells you nothing about the underlying problem or how often it's happening.
Closing that gap is what an external monitor is for: something outside your infrastructure that polls the endpoint on a fixed interval, reads the JSON, and pings you the moment status flips to down. That's the entire reason CanaryHub exists, and it pairs the endpoint poll with the heartbeat above so the background jobs your /health can't see get watched too. Your app texts you before your users do.
Write the handler well: shallow liveness, deep readiness with timeouts, a small JSON body that names the failure. Then make sure something is on the other end reading it, or you've built a smoke detector with no battery.