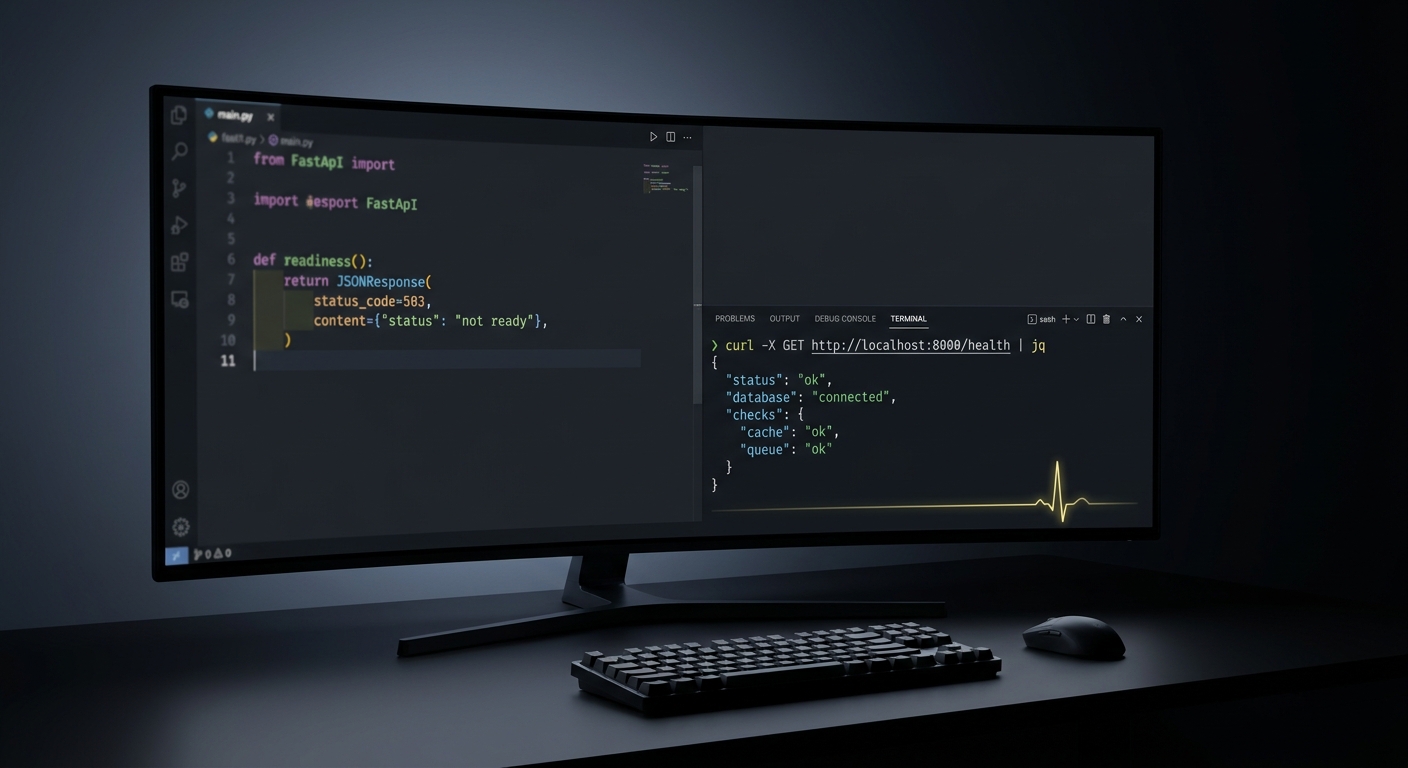
A FastAPI health check is a small endpoint that returns 200 when your app can do its job and a non-2xx status when it can't. The useful version is two routes, not one: a shallow liveness check that only proves the Python process is running, and a deep readiness check that confirms the app can actually reach its database and dependencies. Return 503 the moment a dependency fails, and name the failing one in the body. Everything after this is detail on those two routes and the part most guides skip, which is who calls them.
What does a FastAPI health check actually do?
It answers a yes/no question for a machine, on a schedule, with as little work as possible. Docker calls it to decide whether to restart the container. Kubernetes calls it to decide whether to restart a pod or pull it out of the load balancer. A load balancer calls it to decide whether to keep sending requests to this instance. None of these callers read prose. They read a status code, and sometimes a tiny JSON body.
That framing kills the most common mistake up front: a health check is not a status page and not a metrics endpoint. It runs every few seconds, forever, so it has to be cheap. If it does real work, you have built a scheduled load test against your own database.
How do I add a basic health check to FastAPI?
The smallest thing that works:
from fastapi import FastAPI

app = FastAPI()

@app.get("/healthz")
def healthz():
    return {"status": "ok"}
If this handler runs at all, the process is up, the event loop is turning, and FastAPI is routing requests. For a lot of small apps that is genuinely enough on day one. It is also the trap: this route returns 200 even when your database is on fire, because it never looks. It proves the web server answers, not that the app works. That gap is the whole reason you split the check in two.
What's the difference between a liveness and a readiness check?
They answer different questions and trigger different actions, so conflating them causes real outages.
- Liveness: "is this process broken beyond recovery?" If it fails, the right response is to kill and restart the container. Keep it shallow. It must not touch the database, Redis, or any external service, because those failing does not mean your process needs a restart.
- Readiness: "can this instance serve a request right now?" If it fails, the right response is to stop sending traffic to this instance, but leave it running so it can recover. This is where you check the database and critical dependencies.
The failure modes are opposite. A liveness check that touches the database will restart a healthy app every time the database hiccups, turning a 10-second database blip into a restart storm. A readiness check that skips the database will happily accept traffic it can't serve. Split them:
from fastapi import APIRouter

router = APIRouter(prefix="/healthz", tags=["health"])

@router.get("/live")
def liveness():
    # No dependency checks. Reaching this line proves the process is alive.
    return {"status": "ok"}
How do I check the database in a readiness probe?
Run the cheapest query that proves a real connection, wrap it in a timeout so a hung connection can't hang the probe, and return 503 with a body that says what failed. Here it is with SQLAlchemy's async session:
import asyncio

from fastapi import APIRouter, Depends, status
from fastapi.responses import JSONResponse
from sqlalchemy import text
from sqlalchemy.ext.asyncio import AsyncSession

from .db import get_session  # your existing dependency

router = APIRouter(prefix="/healthz", tags=["health"])

async def check_database(session: AsyncSession) -> None:
    await session.execute(text("SELECT 1"))

@router.get("/ready")
async def readiness(session: AsyncSession = Depends(get_session)):
    checks: dict[str, str] = {}
    ok = True

    try:
        await asyncio.wait_for(check_database(session), timeout=2.0)
        checks["database"] = "ok"
    except Exception:
        checks["database"] = "fail"
        ok = False

    body = {"status": "ok" if ok else "degraded", "checks": checks}
    code = status.HTTP_200_OK if ok else status.HTTP_503_SERVICE_UNAVAILABLE
    return JSONResponse(status_code=code, content=body)
A few things earn their place here:
SELECT 1, not a real query. You are checking that the connection pool can hand you a live connection and the database answers. That is all readiness needs to know. Anything heavier adds cost to a route that runs constantly.asyncio.wait_forwith a hard timeout. A dead database often does not fail fast, it hangs. Without a timeout, your probe hangs with it, the orchestrator's own timeout eventually fires, and you have burned seconds of every check waiting on a socket. Two seconds is a sane ceiling for aSELECT 1.- A body that names the failure. When you get paged at 3am,
{"status": "degraded", "checks": {"database": "fail", "redis": "ok"}}tells you where to look before you have even opened a terminal. Most guides stop at returning a status code and skip this, which is the difference between a probe that pages you and a probe that helps you.
Add more dependencies the same way. Check them concurrently with asyncio.gather if you have several, keep every one behind its own timeout, and flip ok to false if any required dependency fails. If a dependency is optional (a cache you can serve without), you can report it as failed in the body while still returning 200, which is the honest meaning of "degraded".
How do I wire the health check into Docker?
Use Docker's HEALTHCHECK instruction, and point it at your liveness route, not readiness. Docker's only lever is restarting the container, and you do not want it restarting a healthy app because the database is briefly unreachable.
HEALTHCHECK --interval=30s --timeout=3s --start-period=20s --retries=3 \
  CMD python -c "import urllib.request,sys; sys.exit(0 if urllib.request.urlopen('http://localhost:8000/healthz/live', timeout=2).status == 200 else 1)"
Note that this does not use curl. The official python:*-slim images do not ship curl or wget, so the common curl -f http://localhost:8000/healthz you see in tutorials fails with "not found" inside a slim container, and Docker reports the container unhealthy for the wrong reason. Python is already in the image, so a one-line urllib call needs no extra packages. The flags mean: check every 30 seconds, fail the individual check after 3 seconds, give the app 20 seconds to boot before the first check counts, and mark the container unhealthy only after 3 checks in a row fail.
HEALTHCHECK on its own only labels the container healthy or unhealthy. To actually act on that, use a restart policy plus something like autoheal in Docker Compose, or move to an orchestrator that restarts on the signal.
How do I use it with Kubernetes probes?
Kubernetes maps cleanly onto the two routes, plus a third probe for slow starts:
livenessProbe:
  httpGet:
    path: /healthz/live
    port: 8000
  periodSeconds: 10
readinessProbe:
  httpGet:
    path: /healthz/ready
    port: 8000
  periodSeconds: 10
startupProbe:
  httpGet:
    path: /healthz/live
    port: 8000
  failureThreshold: 30
  periodSeconds: 2
livenessProbehits/healthz/live. On failure, the kubelet restarts the container.readinessProbehits/healthz/ready. On failure, the pod is removed from the Service's endpoints, so it stops receiving traffic, but it keeps running so it can recover.startupProbehits the liveness route and holds the other two off until the app has booted. WithfailureThreshold: 30andperiodSeconds: 2, a slow-starting app gets up to 60 seconds to come up before liveness can start killing it. Without this, an app that takes 40 seconds to load models or run migrations gets restarted mid-boot, over and over.
Why a health check is not monitoring
Here is the part every FastAPI health-check guide leaves out, and it is the one that pages you at the worst possible time.
Every mechanism above shares one assumption: something inside your infrastructure is still alive to make the call and act on the answer. Docker's HEALTHCHECK can restart a container only while the Docker daemon and the host are up. Kubernetes probes work only while the node and the kubelet are up. A load balancer's health check works only while the load balancer is up. When the failure is bigger than the container (the Fly.io machine stopped, the deploy is crash-looping, DNS broke, the TLS certificate expired, the whole app is unreachable) there is nothing inside the box to notice, because the box is the thing that's down. Your /healthz/ready route is returning 503 to an audience of no one.
The fix is a request from outside your own stack. Something on a different network makes the same GET a user's browser would, on a schedule, and pages a human when it fails or times out. That is uptime monitoring, and it is a different job from a health check even though it calls the same URL.
The pattern splits by whether the thing has an inbound URL:
- Anything with a public URL (your API, your web app) gets polled from outside. Point an external monitor at
https://yourapp.com/healthz/readyand have it alert on a non-200 or a timeout. - Anything without an inbound URL (a background worker, a cron job, a queue consumer) can't be polled, so flip it around. Have the job ping a URL when it finishes, and get alerted on silence. That is a dead man's switch, and it catches the failure mode a health check structurally cannot: the job that never ran at all.
This is what CanaryHub does from outside your infrastructure, on a free tier: it polls your public health endpoint from a separate network and runs heartbeat monitors for the jobs that have nothing to poll. A worker pings https://ingest.canaryhub.ai/ping/<token> at the end of each run, and if the ping is late, you get a message on Telegram before your users notice. The health check tells your orchestrator when to restart something. The external monitor tells you when the orchestrator itself went dark.
Common health-check mistakes
- Liveness that checks the database. The single most common one. It converts every dependency blip into a restart, which is worse than the blip.
- No timeout on the checks. A hung dependency hangs the probe, which quietly fails every check until an outer timeout fires. Put a hard
asyncio.wait_foron each check. - A check that always returns 200. If it never inspects anything, it only proves the web server accepts connections. That is a liveness check wearing a readiness label.
- An expensive check. Running a real query, hitting every downstream service, or worse, running migrations on each call means your probe is a recurring load test firing every few seconds.
- Leaking internals on a public route. A detailed readiness body that lists every service and version is a map of your stack. Keep the public route terse, or authenticate the detailed one.
Ship the two routes, wire liveness to restarts and readiness to traffic, then put one external eye on the URL from a network you don't control. If you run anything on a schedule, start with a dead man's switch: see how to monitor a cron job for the heartbeat side of the same idea.