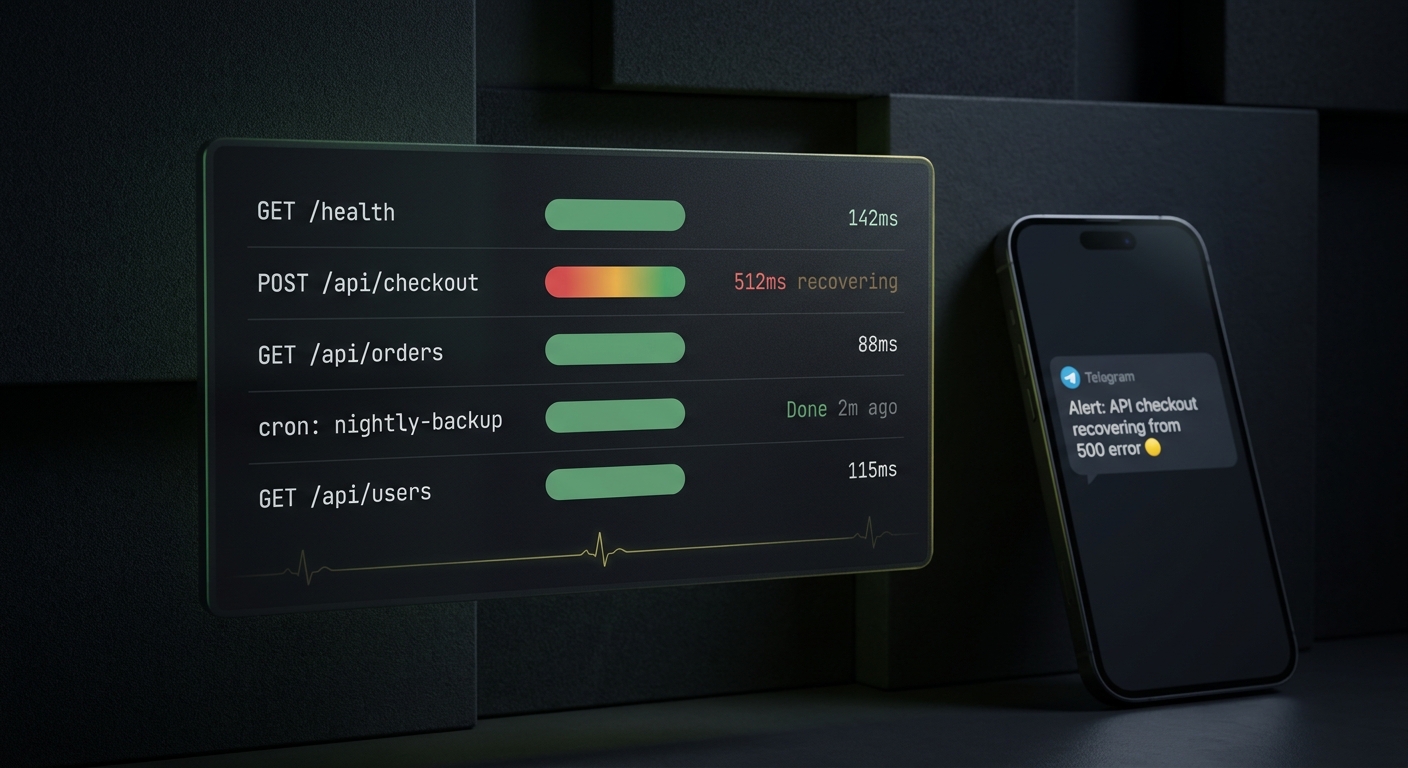
Ask ten developers which API monitoring tool is best and you'll get ten answers, because they're solving different problems. Someone running a Kubernetes fleet at a Series B company needs distributed tracing across forty services. Someone shipping a side project on Fly.io needs to know, on their phone, the minute the API stops responding. The same word covers both, which is why the "15 best tools" listicles are mostly noise: they rank an enterprise APM platform and a bare-bones uptime checker in the same table as if you'd ever choose between them.
This roundup is for the second developer. If you run a handful of services and you want to catch outages, latency spikes, and dead background jobs without standing up an observability stack, here's what to watch and which tools actually fit.
What should an API monitoring tool actually do?
Before the tool list, get clear on the signals. Good API monitoring watches four things:
- Reachability and uptime. Can a request from outside your infrastructure reach the endpoint at all? This is the one that catches DNS failures, expired configs, dead containers, and the whole platform going down. It's the floor, and every tool does it.
- Latency. How long does the request take? A p95 that creeps from 120ms to 900ms is a problem your users feel long before anything returns a 500. You want that number tracked over time, so a slow creep shows up as a trend instead of hiding behind a green checkmark.
- Status and error rate. A 2xx means healthy, a 5xx means broken, and a 4xx usually means the caller did something wrong. A monitor should treat a non-2xx as down, not "still responding."
- Health, including degraded states. A single
/healthendpoint that checks the API's own dependencies (database, cache, queue) turns a blind uptime check into a real readiness check. The useful contract has three states, not two:ok,degraded(the API is up but a dependency is struggling), anddown.
There's a fifth thing the listicles almost always miss: the jobs behind the API. The nightly export, the webhook retry worker, the cron that renews tokens. These have no URL to poll, so uptime tools ignore them, and they fail silently until a customer notices. Watching them needs a heartbeat, which we'll get to.
The best API monitoring tools for indie developers
Ranked by fit for a solo dev or small team, not by feature count. Prices are from each tool's current pricing page as of August 2026; check before you buy, because pricing pages change.
CanaryHub
This is our tool, so read the rest with that in mind. CanaryHub watches web apps and API backends: it polls your endpoint on an interval, tracks latency, treats any non-2xx as down, and parses a structured /health payload so it can tell "up" from "degraded" from "down." It also does heartbeat monitoring for cron jobs, so the background jobs behind your API get watched too. Alerts go to Telegram by default, plus Slack, Discord, and email. The tagline is honest: your app texts you before your users do.
The free plan watches one project at a 5-minute interval with batched Telegram alerts. Pro is $8.99/month, or $71/year (that works out to $5.92/month), and drops the interval to 60 seconds with instant alerts and unlimited monitors.
What CanaryHub does not do: distributed tracing, multi-step synthetic transactions, real-user monitoring, or SSL-certificate-expiry checks. If you need those, keep reading. It's built to be the thing you set up in five minutes and then forget about, not the thing you stare at all day.
UptimeRobot
The default free uptime checker for a reason. The free plan covers 50 monitors at a 5-minute interval, which is genuinely generous for a side project, and the monitor types are broad: HTTP, keyword, port, SSL-certificate expiry, and cron/heartbeat checks are all there. Paid plans (Solo starts at $12/month billed annually) buy faster intervals and more channels. It's simple and reliable. The gap, if you care about it, is that it treats an endpoint as a black box: it won't parse a structured /health payload to tell you the API is up but degraded because a dependency is failing, and its alerting leans on email and integrations rather than a Telegram-first default.
Better Stack
Better Stack (formerly Better Uptime) is the polished option. The free plan includes 10 monitors at up to a 30-second check frequency, which is faster than most free tiers. Paid plans start around $25/month. Its strength is the incident-management and status-page side: on-call scheduling, escalation, and hosted status pages that look good. If you want a public status page and structured on-call more than you want the cheapest checker, it's worth the step up.
Checkly
The pick if you'd rather write your monitors as code than click through a UI. Checkly is developer-first: you define API checks and Playwright browser checks, version them in your repo, and deploy them with a CLI, Terraform, or Pulumi. The free Hobby plan includes 10 uptime monitors plus thousands of API and browser check runs a month; the Starter plan is $24/month. If your instinct is to keep monitoring in the same pull request as the feature, this is the one that respects that.
Postman
If your team already lives in Postman for API development, its scheduled monitors let you reuse the collections you've already written to run checks on an interval. It's convenient rather than best-in-class for uptime, and it makes the most sense when you don't want yet another tool and you've already got the test collections.
Datadog and New Relic
These are APM platforms, not uptime checkers, and that's the point. When "the API is slow" and you need to know whether it's a database query, a downstream call, or garbage collection, distributed tracing is what answers the question, and this is where Datadog and New Relic earn their price. They also cost accordingly and take real setup. Reach for them when you've outgrown "is it up" and you're regularly debugging "why is it slow," not before. For a three-service side project they're overkill.
Prometheus and Grafana (self-hosted)
The open-source route: you scrape metrics with Prometheus, alert with Alertmanager, and visualize with Grafana. Nothing beats it for cost-at-scale and control, and if you're already running it for infrastructure, adding API metrics is natural. The catch for a solo dev is that you're now running and monitoring the monitoring stack itself, which is a real job. Worth it if you enjoy that and have the metrics discipline; a distraction if you just want to know your API is up.
How do I monitor an API in five minutes?
The fastest reliable setup is a dedicated health endpoint plus an external monitor. First, expose a /health route that reports on the API's real dependencies and returns a small JSON body:
{
  "status": "degraded",
  "checks": [
    { "name": "database", "status": "ok" },
    { "name": "redis", "status": "down" }
  ]
}
Return HTTP 200 when overall status is ok, and a 503 when it's down, so even a dumb uptime check catches a hard failure. The degraded state is what lets a monitor warn you that Redis is flapping while the API is technically still serving requests. You can confirm the shape by hand before wiring up any tool:
curl -s https://api.example.com/health | jq .
Then point your monitor at that URL with a check interval and an alert channel, and you're covered for the request path.
For the background jobs that have no URL, add a heartbeat. At the very end of the job, after the real work has succeeded, ping a unique URL:
# last line of your nightly cron job
curl -fsS https://ingest.canaryhub.ai/ping/YOUR_TOKEN
The monitor knows the job's expected schedule. If the ping doesn't arrive on time, the silence is the alert. That's the piece pure uptime tools leave uncovered, and it's usually where the quiet, expensive failures hide.
So which one should you actually pick?
If you want the short version: start free, get alerts on your phone, and only add complexity when a real problem demands it.
- Running a few services and a couple of cron jobs, and you want to be told the moment something breaks? A lightweight monitor with heartbeats covers you for close to nothing. CanaryHub leans on a Telegram-first default and degraded-state health checks; UptimeRobot gives you the broadest set of free monitor types.
- Want your monitors in version control? Checkly.
- Want a polished public status page and on-call scheduling? Better Stack.
- Regularly debugging why requests are slow, past the point where knowing whether they're up is enough? That's when Datadog or New Relic start to pay for themselves.
There's no single best API monitoring tool, only the smallest one that reliably catches the failures you actually have. Pick that, wire up a /health endpoint and a heartbeat, and get back to shipping.